Financial Summary
(Billion yen)
(Years ended March 31)
| 2019 | 2020 | 2021 | 2022 | 2023 | |
|---|---|---|---|---|---|
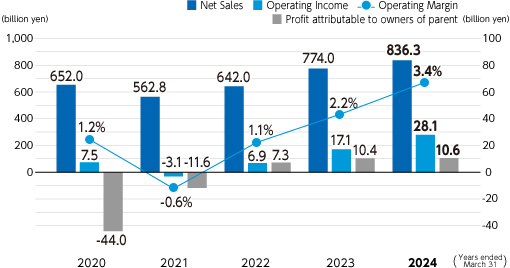
| Net Sales | 733.8 | 652.0 | 562.8 | 642.0 | 774.0 |
| Operating Income | 27.2 | 7.5 | -3.1 | 6.9 | 17.1 |
| Operating Margin | 3.7% | 1.2% | -0.6% | 1.1% | 2.2% |
| Profit Attributable to Owners of Parent | -7.0 | -44.0 | -11.6 | 7.3 | 10.4 |
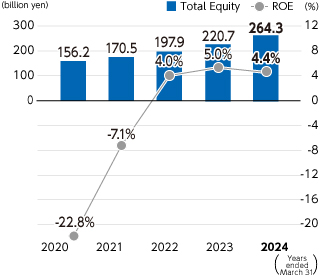
| Total Equity | 230.2 | 156.2 | 170.5 | 197.9 | 220.7 |
| ROE (Return On Equity) | -2.9% | -22.8% | -7.1% | 4.0% | 5.0% |
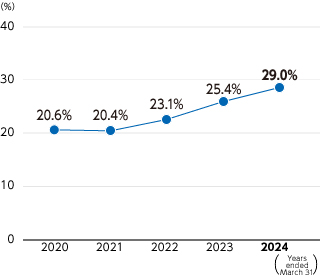
| Equity to Capital Ratio | 27.4% | 20.6% | 20.4% | 23.1% | 25.4% |
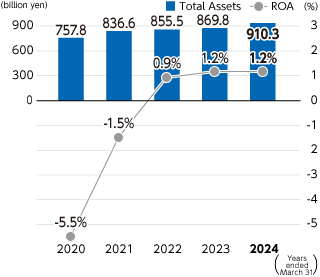
| Total Assets | 840.8 | 757.8 | 836.6 | 855.5 | 869.8 |
| ROA (Return On Assets) | -0.8% | -5.5% | -1.5% | 0.9% | 1.2% |
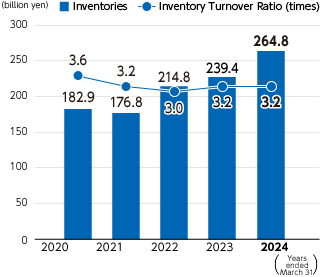
| Inventories | 194.5 | 182.9 | 176.8 | 214.8 | 239.4 |
| Inventory Turnover Ratio (times) | 3.8 | 3.6 | 3.2 | 3.0 | 3.2 |
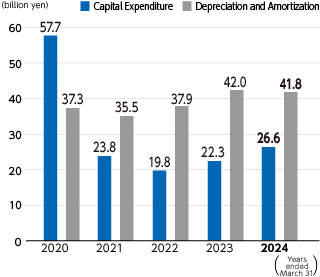
| Capital Expenditure | 45.2 | 57.7 | 23.8 | 19.8 | 22.3 |
| Depreciation and Amortization | 38.9 | 37.3 | 35.5 | 37.9 | 42.0 |
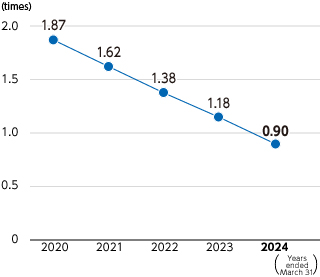
| Net D/E Ratio | 1.16 | 1.87 | 1.62 | 1.38 | 1.14 |
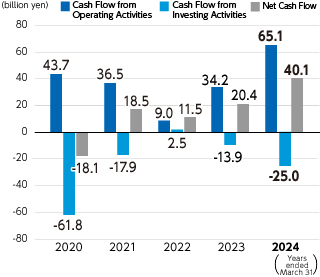
| Cash Flow from Operating Activities | 43.2 | 43.7 | 36.5 | 9.0 | 34.2 |
| Cash Flow from Investing Activities | -65.6 | -61.8 | -17.9 | 2.5 | -13.9 |
| Net Cash Flow | -22.4 | -18.1 | 18.5 | 11.5 | 20.4 |
Net Sales/Operating Income/Operating Margin/Profit Attributable to Owners of Parent
Total Equity/ROE(Return On Equity)
Equity to Capital Ratio
Total assets/ROA (Return On Assets)
Inventories/Inventory Turnover Ratio
Capital Expenditure/Depreciation
Net D/E Ratio
Net Cash Flow
