Realize Carbon Neutrality
Target Year for Carbon Neutrality
CO2 emission reduction targets (Scope 1 and 2)
50% reduction by the fiscal year 2030(compared to the fiscal year 2018)
Achieve carbon neutrality by the fiscal year 2035
CO2 emission reduction targets (Scope 3)
Achieve carbon neutrality by the fiscal year 2050
Carbon Neutrality Strategy Promotion Dept. Launched
Based on the activity result of the carbon neutrality promotion project from July 2022 to March 2023, the “Carbon Neutrality Strategy Promotion Dept.” was launched in April 2023. It inherits the projects, establishes the global promotion system, and shifts to the execution phase, including the mid-to-long-term issues.
With the Goal of Target Year for Carbon Neutrality
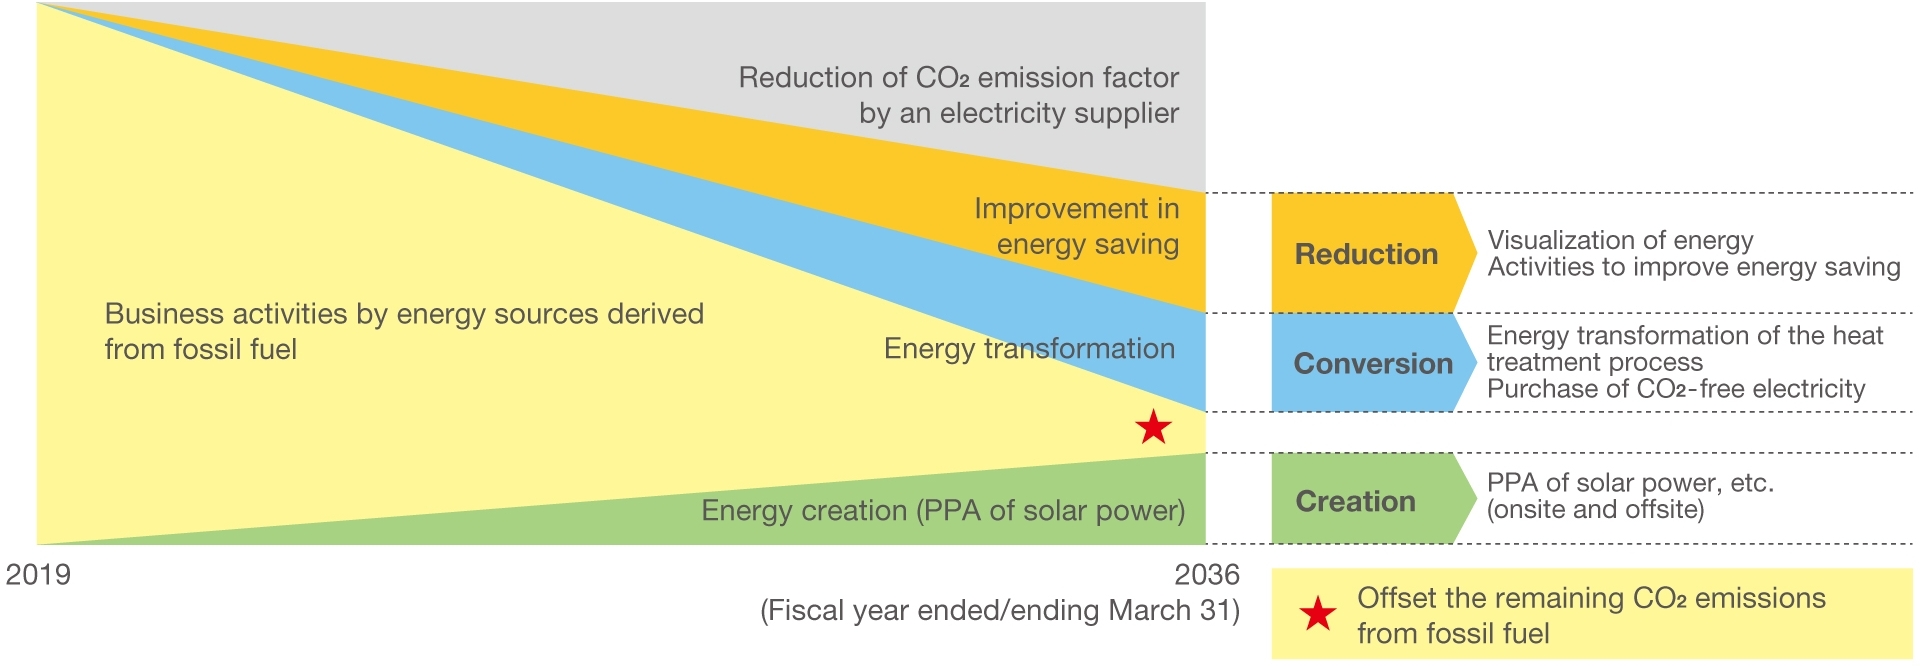
The NTN Group is working on the following priority measures for the purpose of steadily promoting an action plan for achieving carbon neutral targets.
(1) Reduce CO2 emissions generated by processing machines and heat treatment equipment by visualizing the energy used in the manufacturing process, and reduce CO2 emissions by improving the efficiency of energy used in utilities such as air, air conditioning, and lighting.[Reduction]
(2) Reduction of CO2 emissions by energy conversion of heat treatment equipment[Conversion]
(3) Reduction of CO2 emissions derived from fossil fuels by purchasing CO2-free electricity[Conversion]
(4) Reduction of CO2 emissions derived from fossil fuels through renewable energy power generation such as solar power PPA[Creation]
■Carbon neutrality realization image
Respond to climate change
CO2 Emission Reduction Initiatives
Own Emissions (Scope 1 (Direct Emissions), Scope 2 (Indirect Emissions))
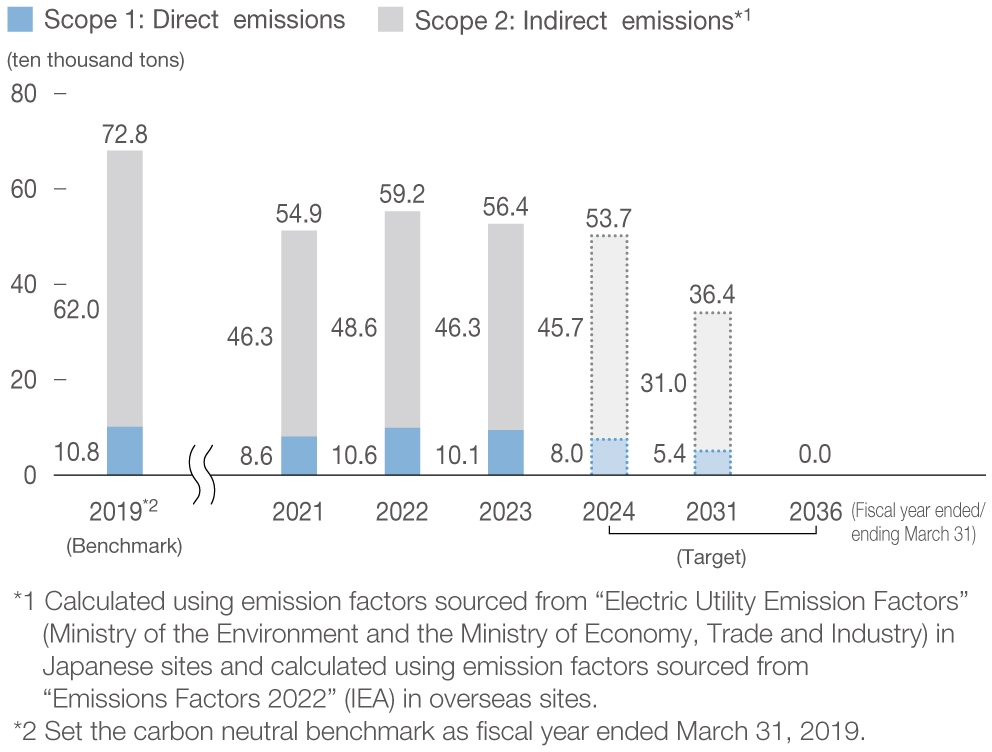
The NTN Group is working on CO2 reduction in the whole of the company’s business activities and aiming to reduce CO2 by 50% compared to the fiscal year 2018 by fiscal year 2030 and achieve carbon neutrality by fiscal year 2035. We receive a third-party verification to ensure no problem in the calculation method of CO2 emissions. For Scope 2, the calculation uses emission factors*1 of the market-based approach for domestic business sites and emission factors*2 of the location-based approach for overseas business sites. We are also considering emission factors of the market-based approach to calculate the emissions of overseas businesses.
*1 Calculated using emission factors sourced from “Electric Utility Emission Factors” (Ministry of the Environment and the Ministry of Economy, Trade and Industry) in Japanese sites
*2 Calculated using emission factors sourced from “Emissions Factors 2022” (IEA) in overseas sites.
■CO2 emissions (Scope1,2)
Reduction of CO2 emissions from the burning of fuel and the use of electricity (Scope 1 and 2)
The NTN Group is working to reduce CO2 emissions (Scope 1) from fuel combustion in heat treatment facilities and boilers, etc. For heat treatment facilities, which are a major source of CO2 emissions, we have completed fuel conversion to LPG* and city gas at major facilities as the first phase of energy-saving measures. In the future, we will not only expand the use of high-efficiency high-frequency heating equipment and electric furnaces that use renewable energy, but also consider the use of green energy sources such as ammonia and hydrogen, which do not emit CO2 during production and use, to promote carbon neutrality by utilizing a variety of energy sources.
In addition, The NTN Group is working to improve the efficiency of air, air conditioning, lighting, and other utilities as part of its efforts to reduce CO2 emissions (Scope 2) associated with the use of electricity in its production activities. We are conducting steady activities to reduce energy use by installing high-efficiency compressors, air conditioning, lighting, and other equipment, regularly taking measures to prevent air leaks, and turning off non-operating equipment.
*Liquefied petroleum gas
■Primary measures for energy saving for utility facilities (fiscal year ended March 31, 2023)
| Energy conservation measures | The number of implemented sites | Electricity reduction (kWh/year) | Reduction of CO2 emissions(tons/year)* | Investment (million yen/year) | Contents | ||||
|---|---|---|---|---|---|---|---|---|---|
| Japan | Overseas | Japan | Overseas | Japan | Overseas | Japan | Overseas | ||
| Compressor updated | 4 | 7 | 737,699 | 1,252,802 | 276 | 201 | 32 | 22 | Upgrade to inverter-type compressor |
| Switching to LEDs lightning | 15 | 20 | 741,619 | 1,556,343 | 285 | 345 | 46 | 73 | Fluorescent and mercury lamps ⇒ LEDs |
| Inverterization of motors and pumps | 4 | 8 | 56,846 | 1,380,117 | 22 | 440 | 5 | 27 | Power saving by frequency control of motor power |
| Transformer updates | 3 | 3 | 55,918 | 1,358,024 | 23 | 518 | 5 | 26 | Upgrading to equipment compliant with the “Top Runner Program” |
| Air conditioning renewal | 12 | 6 | 119,545 | 1,566,527 | 46 | 606 | 44 | 42 | Room temperature optimization by new control method and switching to inverter type |
| Compressed air leak repair activities | 19 | 2 | 883,580 | 3,502,363 | 343 | 1,259 | 1 | 3 | Use air leak detectors to determine leak location and amount |
| Total | 57 | 46 | 2,595,206 | 10,616,176 | 995 | 3,369 | 133 | 193 | |
| Japan and Overseas Total | 103 | 13,211,383 | 4,364 | 326 | |||||
*Calculated using emission factors sourced from “Electric Utility Emission Factors” (Ministry of the Environment and the Ministry of Economy, Trade and Industry) in Japanese sites and calculated using emission factors sourced from “Emissions Factors 2022” (IEA) in overseas sites.
Reduction of energy usage by improving heat treatment equipment
Heat treatment equipment consumes a large amount of energy to heat steel materials at high temperatures using fuel (LPG* and city gas) or electricity. To investigate the energy-saving measures suitable for different heat treatment processes, we visualized the amount of heating energy and atmospheric gas used, added high-efficiency heat-insulating materials, and applied thermal insulation coating to reduce Scope 1 and 2 emissions.
*Liquefied petroleum gas
Visualization of Electricity and Energy Saving Improvements in Production Plants
In-house CO2 emissions from the use of electricity account for 82.1%. We are promoting the implementation of energy-saving measures in which electricity used for product processing is visualized in an appropriate range, such as manufacturing block lines, and an order of priority is set. In domestic production sites with high energy consumption, a model block line is selected, promoting the verification of the effect of energy-saving measures, including the reduction of air/coolant used.
Visualization of energy data
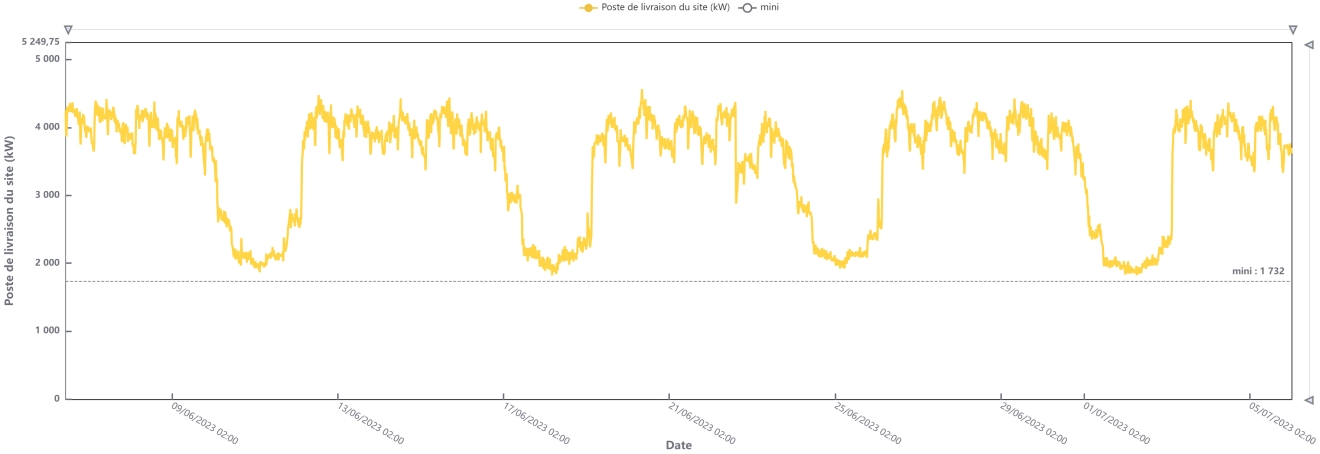
NTN Europe S.A. (France), the reduction of CO2 emissions in business sites has started with the measurement (visualization) of energy currently in use. After collecting each data type, we identify valuable data and select analysis and measures. Visualization of data on energy is indispensable for future measures. Since the beginning of the fiscal year ended on March 31, 2022, we have been introducing equipment that automatically measures the amount of energy in use and a mechanism that “visualizes” the amount of primary energy in use. Although the automatic measuring equipment is introduced only to a limited number of business sites at the moment, it is planned to introduce to other sites gradually. We will continue to promote it so that the energy in use is visualized automatically in each business site in France, sites in Romania, and Brazil in a few years.
■Energy consumption represented in a graph
Promotion of Introduction of Natural Energy Generation and Renewable Energy
The NTN Group is working on reducing CO2 emissions (Scope 2) by introducing self-consumption type natural energy generation to business sites based on various schemes (PPA*1, lease, and self-investment). We are actively promoting the procurement of renewable energy and electricity offset with carbon credit. Reduced 477 tons of CO2 in Japan and 11,409 tons in overseas in the fiscal year ended March 31, 2023. *2
*1 PPA (Power Purchase Agreement): A contract to install solar power generation equipment owned by a third-party power producer on a roof or other location and purchase its electricity.
*2 Calculated using emission factors sourced from “Electric Utility Emission Factors” (Ministry of the Environment and the Ministry of Economy, Trade and Industry) in Japanese sites and calculated using emission factors sourced from “Emissions Factors 2022” (IEA) in overseas sites.
■Natural Energy Generation Results (Fiscal Year Ended March 31, 2023)
| Region | Power generation (kWh) | CO2 emission reduction (tons-CO2)*2 |
|---|---|---|
| Japan | 1,073,015 | 430 |
| China | 11,961,519 | 7,348 |
| Total | 13,034,534 | 7,778 |
■Actual Procurement of Renewable Energy (Fiscal Year Ended March 31, 2023)
| Site name | Energy type | Procurement(kWh) | CO2 emission reduction (tons-CO2)*2 |
|---|---|---|---|
| Nagoya Sales Office | CO2-free electricity | 80,982 | 31 |
| Hamamatsu Automotive Sales Office | 13,077 | 5 | |
| Hiroshima Automotive Sales Office | 20,059 | 11 | |
| NTN-AT | 13,057,800 | 4,061 | |
| Total | 13,171,918 | 4,108 | |
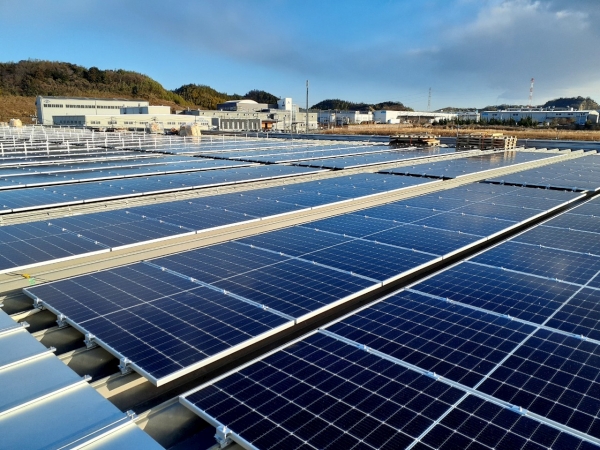
An Example of the Introduction of Natural Energy Generation Equipment in Japan
NTN Mie Corp. (Japan) installed a total of 828 solar panels on the roof of a roller factory based on PPA*1. Its operation started in April 2023, and the amount of power produced and CO2 reduction are expected to be 541,342 kWh/year and 205 ton-CO2/year*2, respectively.
*1 PPA (Power Purchase Agreement): A contract to install solar power generation equipment owned by a third-party power producer on a roof or other location and purchase its electricity.
*2 Calculated using emission factors sourced from “Electric Utility Emission Factors” (Ministry of the Environment and the Ministry of Economy, Trade and Industry).
■Roller Factory (NTN Mie)
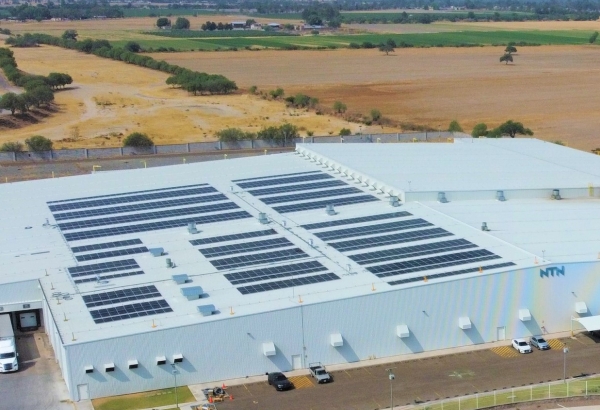
An Example of the Introduction of Natural Energy Generation Equipment in Overseas
NTN MANUFACTURING DE MEXICO, S.A.DE C.V. (Mexico) installed a total of 1,180 solar panels on the roof of a factory based on PPA*1. Its operation started in August 2023, and the amount of power produced and CO2 reduction are expected to be 1,012,000 kWh/year and 403 ton-CO2/year*2, respectively.
*1 PPA (Power Purchase Agreement): A contract to install solar power generation equipment owned by a third-party power producer on a roof or other location and purchase its electricity.
*2 Calculated using emission factors sourced from “Emissions Factors 2022” (IEA).
■NMEX
Introduction of internal carbon pricing
The NTN Group adopted internal carbon pricing (in-house carbon price) system in April 2023. As for equipment/devices to be newly introduced, CO2 expense calculated based on in-house carbon price is used for investment decisions to promote the reduction of CO2 from our business activities.
Reduction of CO2 emissions in the supply chain (Scope 3)
The NTN Group goal is to achieve carbon neutrality, including supply chain emissions (Scope 3), by FY2050. Scope 3 calculations are made at our domestic sites using the Input-Output table and IDEA (Inventory Database for Environmental Analysis) emissions intensity. Category 1, “Purchased Products and Services,” which is the largest emission category among all categories, is mostly due to the procurement of raw steel materials and semi-finished products such as forgings, turned products, and other work-in-process products. In the future, we will improve our Scope 3 calculation method by reviewing the basic unit used, etc., and promote activities on a global basis to identify and reduce emissions in line with actual conditions.
■Supply Chain Emissions (Scope 3) [Japan]
(Unit: tons)
| Category | Fiscal year ended March 31, 2022* | Fiscal year ended March 31, 2023* | ||||
|---|---|---|---|---|---|---|
| Composition ratio | Compared to the previous year | A third-party verification | ||||
| 1 | Purchased goods and services | 1,691,496 | 2,011395 | 92.67% | 18.9% | ○ |
| 2 | Capital goods | 59,752 | 31,648 | 2.78% | 0.9% | ○ |
| 3 | Fuel- and energy-related activities not included in Scopes 1 and 2 | 9,158 | 56,836 | 2.62% | 520.6% | ○ |
| 4 | Transportation and delivery (upstream) 〈not applicable〉 | - | - | - | - | |
| 5 | Waste generated by business activities | 54 | 16,192 | 0.75% | 30034.4% | |
| 6 | Business trips | 1,305 | 1,290 | 0.06% | -1.1% | |
| 7 | Employees’ commuting | 4,740 | 4,687 | 0.22% | -1.1% | |
| 8 | Leased assets (upstream) 〈not applicable〉 | - | - | - | - | |
| 9 | Transportation and delivery (downstream) | 12,686 | 12,666 | 0.58% | -0.2% | ○ |
| 10 | Processing of sold products 〈not applicable〉 | - | - | - | - | |
| 11 | Use of sold products 〈not applicable〉 | - | - | - | - | |
| 12 | Disposal of sold products | 2,428 | 7,061 | 0.33% | 190.8% | |
| 13 | Leased assets (downstream) 〈not applicable〉 | - | - | - | - | |
| 14 | Franchise〈not applicable〉 | - | - | - | - | |
| 15 | Investment〈not applicable〉 | - | - | - | - | |
| Total for categories 1-15 | 1,781,619 | 2,141,775 | 100.0% | 7.10% | ||
*The energy of electric power is calculated using physical quantity (3.6MJ/kWh), and the energy of fuel is calculated using the emission factor sourced from “Emission intensity database for calculation of greenhouse gas emissions of organizations through the supply chain (Ver.3.3)”(Ministry of the Environment).
Reducing CO2 Emissions in Logistics
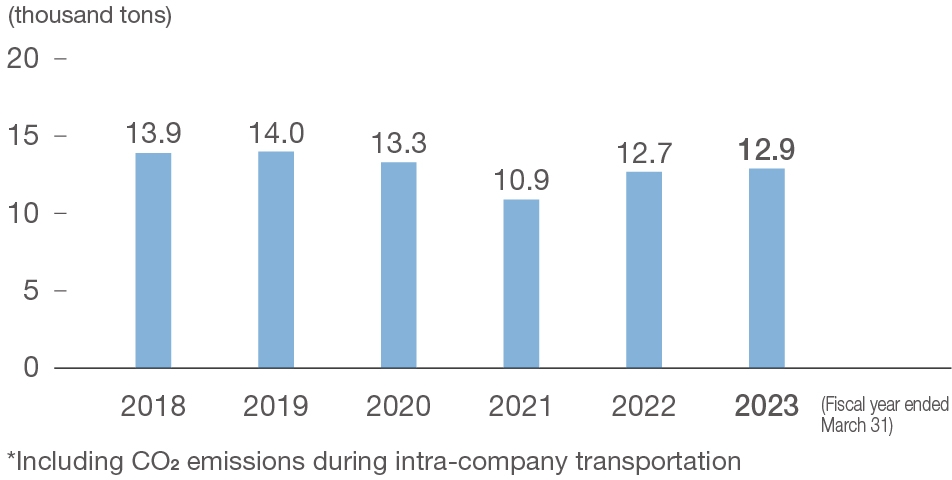
The NTN Group is reducing CO2 emissions (Scope 3 Category 9) during product transportation by improving logistics efficiency. Main measures include “shortening transportation distances by optimizing distribution routes,” “increasing the loading ratio by expanding the use of module outer boxes,” “reducing the number of containers by increasing the loading ratio of export containers” “promotion of reuse and recycling (repair) of wooden pallets,” and “having carries strictly adhere to non-idling requests”. CO2 emissions from the transport of domestic products in the fiscal year ended March 31, 2023, was 12.9 thousand tons-CO2/year (target: 12.8 thousand tons-CO2/year), which is slightly below the target. We will continue to promote the measures, including optimizing a truck’s loading capacity to increase transportation efficiency.
■CO2 emissions in logistics* (Japan)
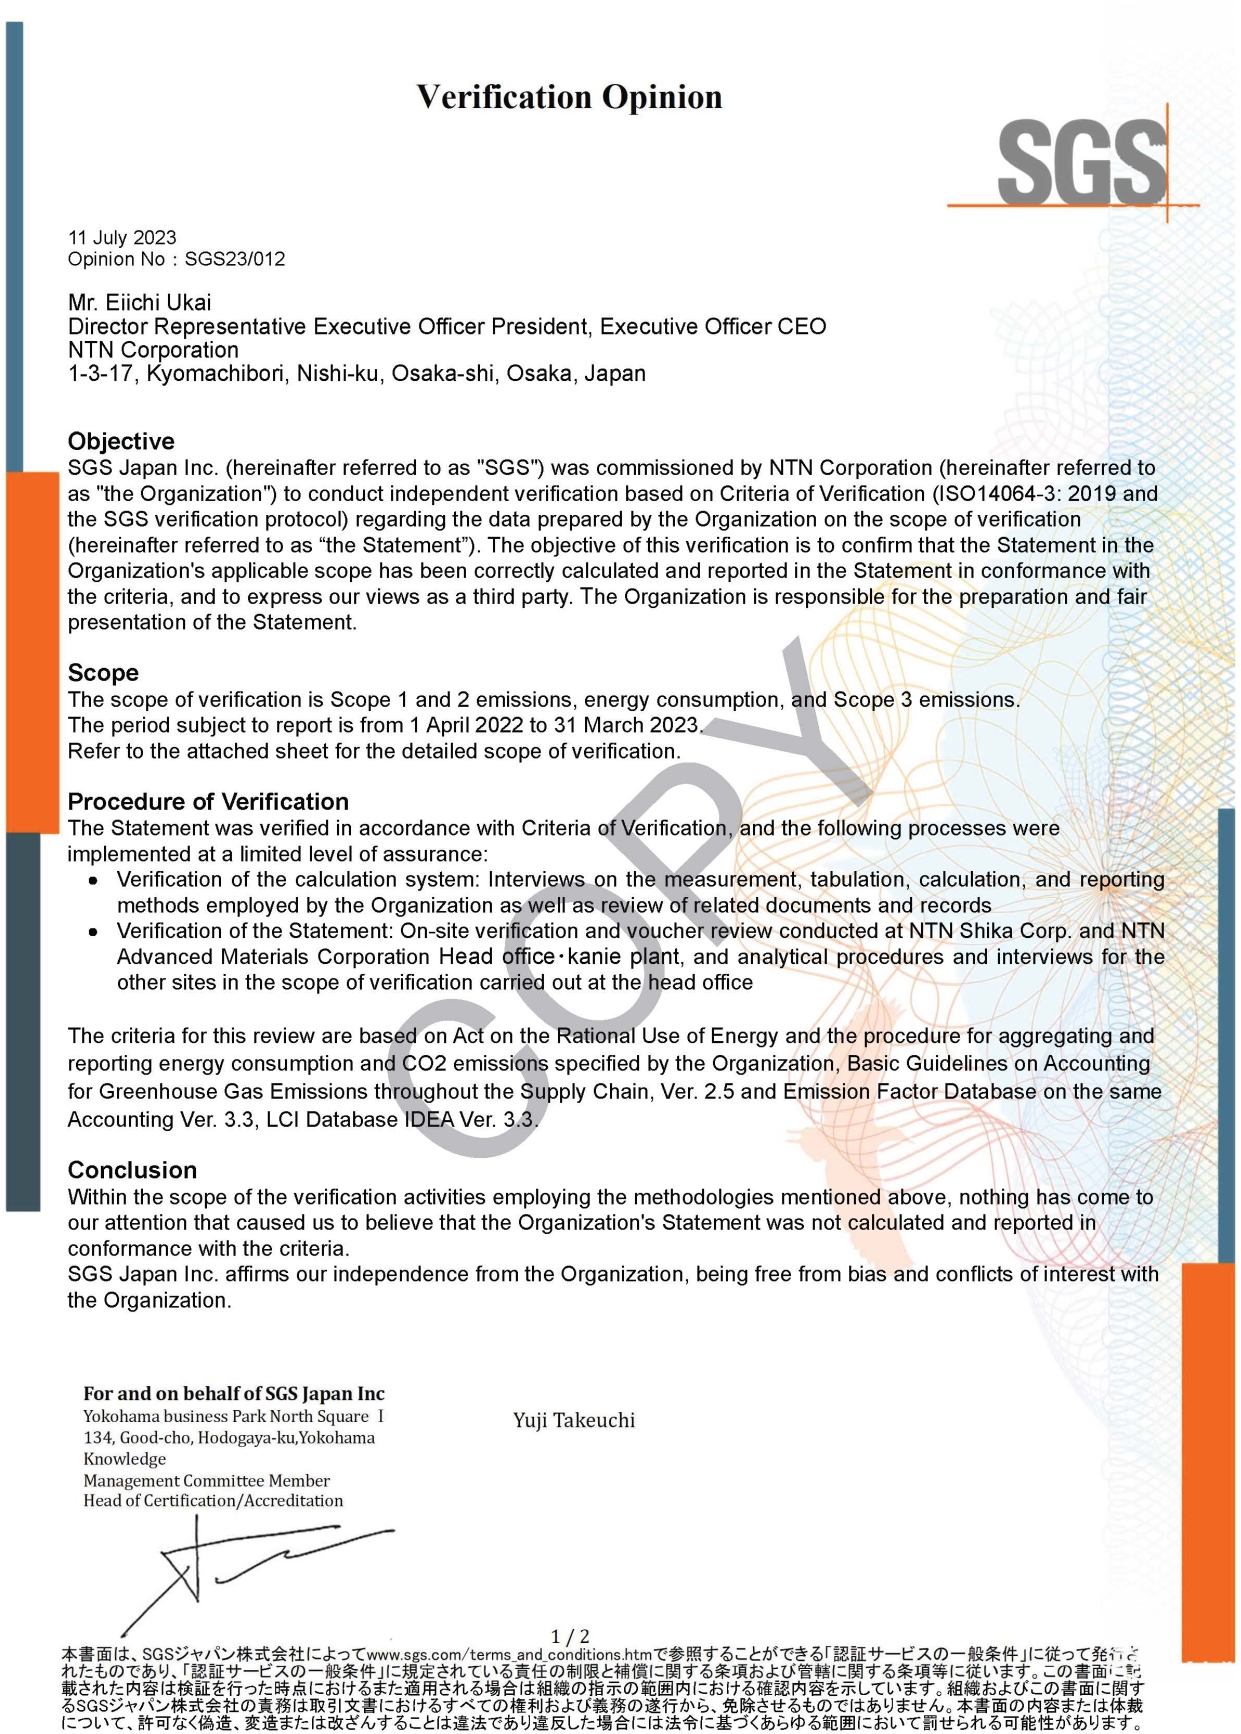
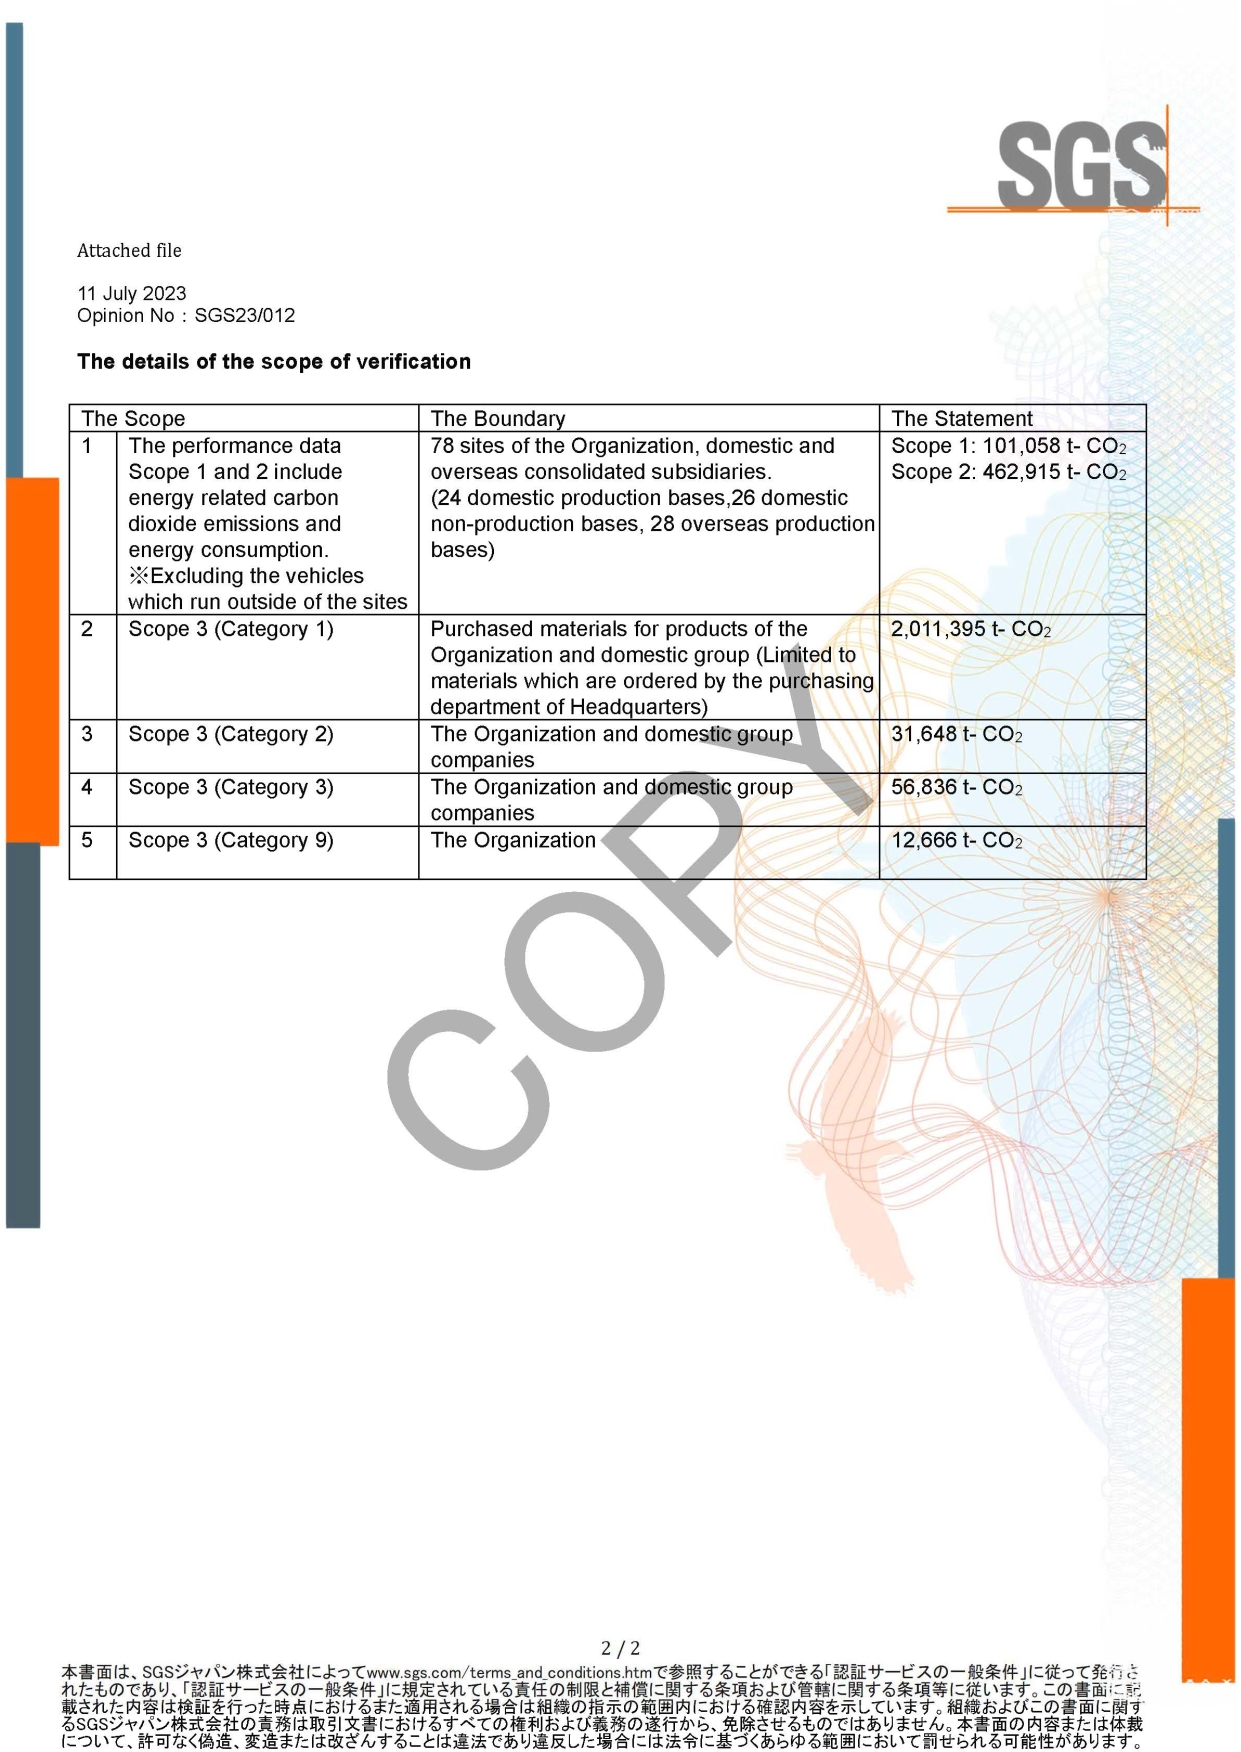
Verification Opinion by a Third Party on CO2 Emissions
A third-party verification of CO2 emissions for the fiscal year ended March 31, 2023 was conducted, confirming that there were no issues with the method for calculating CO2 emissions.